
 Production
Syntech Pivot 1.3
Effective business management is impossible without quick data analysis from various angles. However, analysis often turns into a routine: exporting to Excel, setting up formulas, or constantly rebuilding pivot tables.
Creatio UI & productivity
Ready UI components instead of building from scratch: maps, pivots, diagrams, whiteboard.
The SYNTECH team continues to develop tools that make analytics native and instantaneous. Meet Syntech Pivot version 1.3 - a major update that introduces the concept of multi-views.
The main news:
Previously, one Syntech Pivot component could store only one configuration. If you needed to look at the data from a different perspective, the table had to be reconfigured.
In version 1.3, we added the ability to create multiple Views within a single component. Now you can switch between different data slices in a second.
How does it work in practice?
Imagine you're working in the “Sales” section. One Syntech Pivot component now covers all your needs:
View 1: Revenue by regions and product categories.
View 2: Funnel effectiveness for each manager.
View 3: Deal closure forecast by months.
You simply switch the tab inside the component - and the data is instantly recalculated. This saves time and allows you to keep all key metrics in front of your eyes without cluttering the workspace with dozens of separate tables.
Why Syntech Pivot is a must-have for Creatio users?
Syntech Pivot is an interactive pivot table builder, fully integrated into Freedom UI. It was created for those who demand more from CRM than just data storage.
Key advantages:
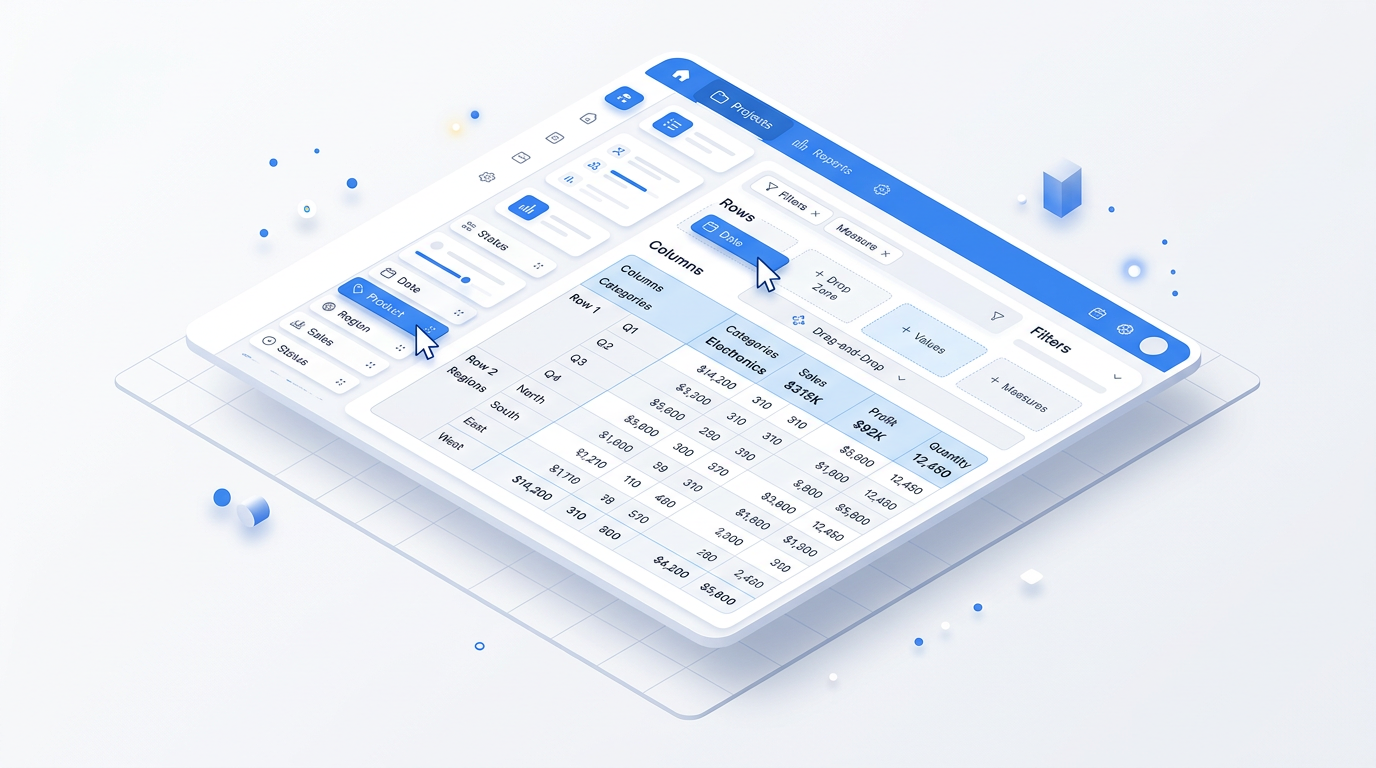
No-Code analytics: Build complex reports using drag-and-drop. Drag fields to rows, columns, or values - no scripts or database queries.
Drill-down to source: Want to know which specific deals made up the million figure? Just click on the cell, and the system will open a list of source records.
Integrated filtering: The component is “smart” - it automatically takes into account all filters you apply to the page in Freedom UI.
9 visualization types: If a table isn't enough, transform it into a chart (bar, line, pie charts, etc.) with a single click.
Calculated columns: Create your own formulas directly within Pivot to calculate margins, bonuses, or percentages.
Technical details and updates
Compatibility: Version 1.3 is fully adapted for Creatio 8.3.1.
Speed: The updated architecture allows processing large data arrays even faster.
Autonomy: You no longer need constant developer assistance to create custom reports.
How to get the update?
The update is already available for download on Creatio Marketplace.
Go to Syntech Pivot on Marketplace: https://marketplace.creatio.com/app/syntech-pivot-creatio
Your business generates gigabytes of data every day. It's time to turn them into clear strategic decisions.
If you have any questions about implementation or want to see a live demonstration of the new functionality - our support team is always in touch: support@syntech.digital.
Next step
Compare with building from scratch
15–30 minutes, no slide decks: we show the solution on your data and tell you if it fits.